WEB VECTOR

Description

Web maps in vector format (international vector tiles) offer many advantages: flexibly configurable, interactive, always sharp, slim, rotatable and tiltable, frequently updated, with attributes, smooth zooming.
Only with Vector Tiles do maps on smartphones and high-resolution screens become a 2D and 3D experience.

The map service basemap.de web vector is a map service for web and mobile developed jointly by the federal and state governments. The Germany-wide map is updated monthly, constantly developed and offers the quality and homogeneity of official geodata. As a web map, the service enables free zooming from the overview of Germany to comprehensive 3D building models and official house numbers in a modern design.

However, using the “Mapbox-compliant” service also relies on special software libraries. If you only use static maps and rely on broad compatibility, you should take a look basemap.de web grid throw.

Deployment

Provided basemap.de web vector as a vector tiles service in the standard map formats color, relief and gray. The service is integrated by calling a style JSON URL.

Tile archives and services URL:

The vector-based web map consists of two thematically separate tile archives: the basic tile archive, which is used for all map styles, and the contour tile archive, which is also used in the “Relief” map style.

• Basic tile archive:
https://sgx.geodatenzentrum.de/gdz_basemapde_vektor/tiles/v1/bm_web_de_3857/bm_web_de_3857.json
To integrate the base tile archive into QGIS, use the following }.pbf

• Contour tile archive:
https://sgx.geodatenzentrum.de/gdz_basemapde_vektor/tiles/v1/bm_web_hl_de_3857/bm_web_hl_de_3857.json
To integrate the contour line tile archive in QGIS, use the following }.pbf

Map styles:

• Color: The standard colored map without terrain representation https://sgx.geodatenzentrum.de/gdz_basemapde_vektor/styles/bm_web_col.json
• Relief: Like color, but with hillshading and contour lines https://sgx.geodatenzentrum.de/gdz_basemapde_vektor/styles/bm_web_top.json
• Gray: Gray variant suitable as a background map https://sgx.geodatenzentrum.de/gdz_basemapde_vektor/styles/bm_web_gry.json

Additional beta styles are available on the project pages under Beta (https://basemap.de/beta) to find.

Up-to-dateness, data model and meta information

The tile archives of basemap.de web vector are updated monthly. The current status of the underlying data sources can be seen here:

• Data updates basemap.de web vector


The underlying data model is relevant for you if you want to make adjustments to the map styles and visualize additional attributes:

• Data model basemap.de web vector


The map styles are defined in json form. An easier-to-read signature catalog in HTML format with all styling layers and regulations can be found here:

• Signature catalog basemap.de web vector color

• Signature catalog basemap.de web vector gray


Further information about the service can be found here Product and quality standard basemap.de web vector can be removed, which is below adv-online.de is published.


Release notes file:

• Release Notes Web Vector

use

View, use mobile, print:
The default map styles from basemap.de web vector can about the basemap.de viewer can be accessed and used. 
The output of high-resolution and large-format maps is also possible.

Develop web applications:
The service is configured to work fully with the following software libraries:
• Mapbox GL JS: https://github.com/mapbox/mapbox-gl-js
• MapLibre GL JS: https://github.com/maplibre/maplibre-gl-js
The service can, for example, be integrated into other web clients, although some limitations in map display and performance must be accepted: OpenLayers, Leaflet.
MaplibreGL JS
Mapbox GL
Leaflet
OpenLayers
<!DOCTYPE html>
<html>

<head>
   <title>basemap.de Web Vektor - MapLibre GL JS Demo</title>
   <script src='https://unpkg.com/maplibre-gl@2.4.0/dist/maplibre-gl.js'></script>
   <link href='https://unpkg.com/maplibre-gl@2.4.0/dist/maplibre-gl.css' rel='stylesheet' />
   <style>
      body {
         margin: 0;
         padding: 0;
      }

      #map {
         position: absolute;
         top: 0;
         bottom: 0;
         width: 100%;
      }
   </style>
</head>

<body>
   <div id="map" class="map"></div>
   <script>
      var map = new maplibregl.Map({
         container: 'map',
         style: 'https://sgx.geodatenzentrum.de/gdz_basemapde_vektor/styles/bm_web_col.json',
         center: [10, 51],
         zoom: 6,
      });
   </script>
</body>

</html>
<!DOCTYPE html>
<html>

<head>
   <title>basemap.de Web Vektor - Mapbox GL JS Demo</title>
   <script src="https://api.mapbox.com/mapbox-gl-js/v1.13.2/mapbox-gl.js"></script>
   <link rel="stylesheet" href="https://api.mapbox.com/mapbox-gl-js/v2.3.0/mapbox-gl.css">
   <style>
      body {
         margin: 0;
         padding: 0;
      }

      #map {
         position: absolute;
         top: 0;
         bottom: 0;
         width: 100%;
      }
   </style>
</head>

<body>
   <div id="map" class="map"></div>
   <script>
      // For Mapbox GL JS > Version 2 you need an access token to make the map appear
      mapboxgl.accessToken = '<your access token here>';
      var map = new mapboxgl.Map({
         container: 'map',
         style: 'https://sgx.geodatenzentrum.de/gdz_basemapde_vektor/styles/bm_web_col.json',
         center: [10, 51],
         zoom: 6,
      });
   </script>
</body>

</html>
<!DOCTYPE html>
<html>

<head>
   <title>basemap.de Web Vektor - Leaflet Demo</title>
   <link rel="stylesheet" href="https://unpkg.com/leaflet@1.8.0/dist/leaflet.css" />
   <style>
      body {
         margin: 0;
         padding: 0;
      }

      #map {
         position: absolute;
         top: 0;
         bottom: 0;
         width: 100%;
      }
   </style>
</head>

<body>
   <div id="map"></div>
   <script src="https://unpkg.com/maplibre-gl@2.4.0/dist/maplibre-gl.js"></script>
   <script src="https://unpkg.com/leaflet@1.8.0/dist/leaflet.js"></script>
   <script src="https://unpkg.com/@maplibre/maplibre-gl-leaflet@0.0.17/leaflet-maplibre-gl.js"></script>
   <script>
      var map = L.map('map', {
         minZoom: 6,
         maxZoom: 18,
      });
      var gl = L.maplibreGL({
         style: 'https://sgx.geodatenzentrum.de/gdz_basemapde_vektor/styles/bm_web_col.json',
      }).addTo(map);
      map.setView([51, 10], 6);
   </script>
</body>

</html>
For optimal integration with Open Layers, several resources are required, which you will find in the following section. Further information can be found on the OpenLayers website.

index.js

import "ol/ol.css";
import { apply as applyMapboxStyle } from "ol-mapbox-style";
import Map from "ol/Map";
import View from "ol/View";
import { useGeographic as olUseGeographic } from "ol/proj";
import {
  DragRotateAndZoom,
  defaults as defaultInteractions
} from "ol/interaction.js";

olUseGeographic();

const center = [6.958307, 50.941357];

const map = new Map({
  interactions: defaultInteractions().extend([new DragRotateAndZoom()]),
  view: new View({
    center: center,
    zoom: 17
  }),
  target: "map"
});

applyMapboxStyle(
  map,
  "https://sgx.geodatenzentrum.de/gdz_basemapde_vektor/styles/bm_web_top.json"
);

index.html

<!DOCTYPE html>
<html>
  <head>
    <title>basemap.de Web Vektor - OpenLayers Demo</title>
    <meta charset="UTF-8" />

    <style>
      html,
      body,
      #map {
        font-family: sans-serif;
        margin: 0;
        width: 100%;
        height: 100%;
      }
    </style>
  </head>

  <body>
    <div id="map"></div>

    <script type="module" src="index.js"></script>
  </body>
</html>

package.json

{
  "Surname": "basemap.de-openlayers-demo",
  "version": "1.0.0",
  "description": "basemap.de Web Vector - OpenLayers Demo",
  "Main": "index.html",
  "scripts": {
    "begin": "vite",
    "build": "vite build"
  },
  "dependencies": {
    "oil": "7.3.0",
    "ol-mapbox-style": "10.3.4",
    "vite": "4.2.1"
  },
  "devDependencies": {
    "@babel/core": "7.2.0",
    "typescript": "4.4.4"
  },
  "resolution": {
    "@babel/preset-env": "7.13.8"
  },
  "keywords": ["javascript", "basemap.de"]
}
Integrate into QGIS:
QGIS supports vector tile services natively from version 3.16, although there are still limitations. Some advantages include the use of arbitrary projections, output as a vector PDF and overlaying with your own GIS data. Basically, QGIS currently does not fully support the Mapbox specifications used by basemap.de, so that there are different representations, especially with regard to the integrated hillshading (relief style) and the representation of some content in relation to the zoom levels. An optimal display of the basemap.de web vector is possible via the basemap.de viewer or GIS applications that support the Maplibre library.

You can use the following XML file to integrate it into QGIS. In the QGIS browser, right-click [Vector Tiles] → [Load Connections] and select the downloaded XML file.
For the fonts of the basemap.de web vector styles (QGIS versions 3.16 to 3.26) to be displayed correctly, the following fonts should be on the
Operating system to be installed:

https://github.com/googlefonts/noto-fonts/tree/master/hinted/ttf/NotoSans

• Noto Sans Regular
• Noto Sans Italic
• Noto Sans Bold
• Noto Sans Extra Condensed Light

https://github.com/googlefonts/roboto/tree/main/src/hinted

• Robot Bold
• Roboto Italic
• Roboto Medium
• Roboto Medium Italic
• Robot Regular


ArcGIS Pro:
Näheres in Kürze

ArcGIS Online und ArcGIS Enterprise-Portal (ab Version 11.1 für Windows):
1. Save the JSON style of the desired basemap.de vector tile layer as a file (e.g.: https://sgx.geodatenzentrum.de/gdz_basemapde_vektor/styles/bm_web_col.json)
2. Any hosted in ArcGIS Online or ArcGIS Enterprise Copy and save vector tile layer. This can also be a Vector Tile basemap published by Esri (e.g OpenStreetMap).
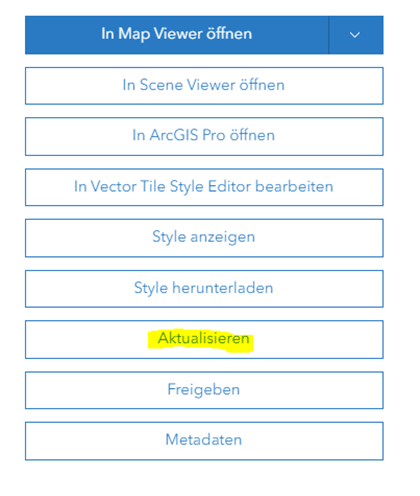
3. On the Item details page The “Update” option can now be used in the created layer copy and the existing style can be replaced with the previously saved basemap.de JSON style. It references the basemap.de vector tile layer and displays it in the selected style.

Figure 1: “Update Style” option

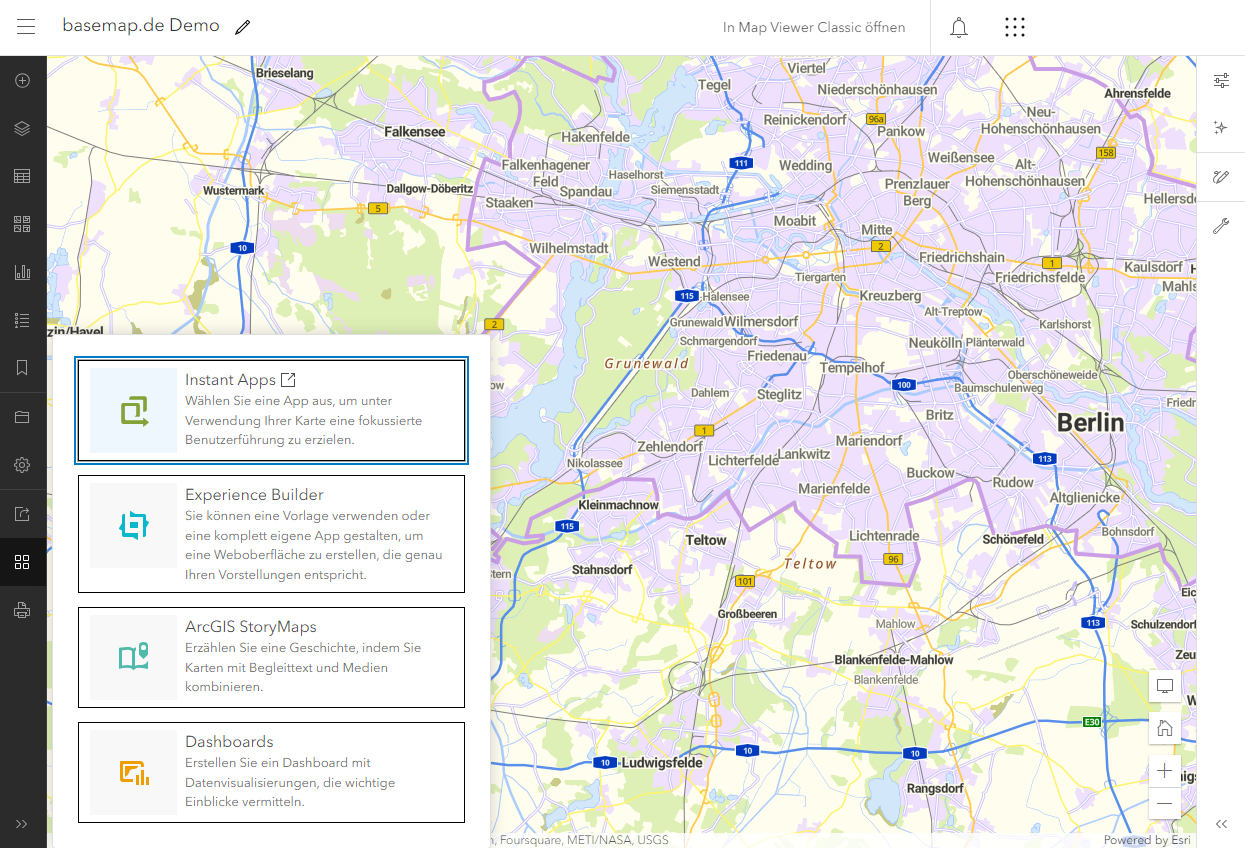
4. The created layer can now be used in ArcGIS Map Viewer can be used as a layer or as a basemap.
Figure 2: basemap.de color style in ArcGIS Online Map Viewer


Get creative:
The map styles provided can be customized. For example, the online editor Maputnik can be used for this purpose. Example URL for the color style:
https://maputnik.github.io/editor/?style=https://sgx.geodatenzentrum.de/gdz_basemapde_vektor/styles/bm_web_col.json#6/51/10

You can find suggestions for thematic web maps in the following chapter.

Application examples

Wind turbine density in Germany

The wind turbine density is displayed in a so-called heat map.
Each wind turbine has a blue radius with a gradient. If there are clusters of wind turbines and the radii overlap, they turn into “warmer” colors – similar to a color scale known from thermal imaging cameras. Blue (cold), Green (cool), Yellow (warm), Orange (medium), Red (hot).

A customized form of the Gray map style was used for the background map.

In principle, such a heatmap can be created with all point objects. The wind turbines from the ATKIS® Basic DLM were used here as an example. These were converted into GeoJSON and visualized as a heatmap.

Tools used: QGIS to play the GeoJSON file, Maputnik to design the map style, a code editor to customize the Html file.

Architectural monuments in Brandenburg

As an example, some selected architectural monuments in the state of Brandenburg were integrated as GeoJSON.
Source: Brandenburg State Office for Monument Preservation (https://gis-bldam-brandenburg.de/index.php?page=dienste.php)

A three-dimensional red representation was chosen for the monuments in order to highlight them on the gray background map.

With a click of the mouse, information about the selected monument appears in a pop-up window.

As with all other application examples listed here, the Java script library Mapbox GL JS is used for map display. This allows the mouse click function and the pop-up window to be configured.

Rescue meeting points in Germany

The rescue points (integrated as GeoJSON) are visualized by a separately integrated symbol, as it is not included in the standard symbol library ("Sprites").

Information is available in a pop-up window at the click of a mouse.

Source data: © KWF-Rettungsstellen v2.8, www.rettungsstellen-forst.de (as of 2020)

Directions sketch or directions

In this example, a route sketch or description in Berlin is shown with individual markers and the gray version of the Smart Mapping web map as the background.

The route description is created either through in-house digitization in a GIS or via the Open Route Service as GeoJSON and integrated into the web map.

With a mouse click, the markers show information in a pop-up window.

City map with tree register

Note: Please be patient while loading the trees, which may take 10-20 seconds in this prototype application.

The tree locations from the tree register as GeoJSON and the use of additional JavaScript libraries (deck.gl, luma.gl, turf.js) enable three-dimensional trees to be displayed on a city map of Hamburg. Source data: Transparency portal Hamburg (as of 2019)

By pressing and holding the right mouse button the scene can be rotated freely. By clicking on a tree, information about the genus, trunk circumference and crown diameter can be accessed. The height of the trees is not known in this example; it is derived from the crown diameter.

Alternatively, in the following application the tree cadastre is also used in a two-dimensional map, here exclusively with the functionality of the Mapbox library.

Streets wider than 5.5m

Based on the "Gray" map style (simplified and reduced in terms of content), all streets with a width of 5.5m to 6m are shown in orange and over 6m in green, for example to plan accessibility with over-wide vehicles.

To label streets, the information available in the tile archive about the width of streets, which is maintained in the ATKIS® Basic DLM, is used.

Parcels in Brandenburg

As an example, the parcels, corridors and districts of the state of Brandenburg (OpenData: https://geobroker.geobasis-bb.de/gbss.php?MODE=GetProductInformation&PRODUCTID=6de36219-3e68-489e-8ebc-632e5ffb6dc9) were included in the smart mapping Web map integrated.

The background map used the “Relief” map style.

The examples show that ALKIS information can also be presented as a vector tiles web map in a high-performance and flexibly changeable manner and offers potential for various use cases.

Combination of two vector tile services in OpenLayers

In OpenLayers, two vector tile services can be represented in one map application, such as the official services of Switzerland and Germany in this example.

Further information about the Swisstopo “Light Base Map” service: https://www.swisstopo.admin.ch/de/geodata/maps/smw/smw_lightbase.html

Animated building height map

On the map, the buildings are colored according to a height classification. The reduced background is in a dark card style.

Mapbox GL JS enables map rotation. By defining a center, you determine where the tracking shot focuses on. However, the map can still be moved and zoomed.

Further examples of camera control in Mapbox GL: https://docs.mapbox.com/mapbox-gl-js/examples/#camera

LoD2 buildings

In the map application, all 3D buildings and structures in Germany are displayed at Level of Detail 2 (LoD2).

They are based on the Germany-wide, official 3D building model (LoD2-DE), in which the buildings and structures with standardized roof shapes are modeled according to the actual ridge courses.
The building floor plans are usually taken from the official property map. Further information about the data can be found here: http://www.adv-online.de/AdV-produkte/Weitere-produkte/3D-Gebaeudemodelle-LoD/

For visualization, the data available in CityGML was transferred to an OGC-compliant 3D tile archive (3D Tiles) and integrated into the map application using Mapbox GL JS and other libraries. The colored web map is shown in the background, which was adapted for 3D visualization using the Map Editor.

Note: The 3D buildings are only loaded from a certain distance (zoom level > 16).

frequently asked Questions

As of: July 17, 2023

Can the basemap.de web vector vector map also be used with Esri products (e.g. ArcGIS)?

Wie Sie die basemap.de Web Vektor in ArcGIS Pro, ArcGIS Enterprise und ArcGIS Online einbinden, können Sie im oberen Bereich unter Punkt "Nutzung" nachlesen.

Can I embed the web map on my website (e.g. via i-frame)?

Yes, integrating the basemap.de web vector and web raster into your own website is permitted.

Can I adapt the basemap.de Web Vector web map to my needs?

Yes, the basemap.de web vector can be customized. You can find information about this on this page.

How do I integrate the basemap.de web vector into QGIS?

From QGIS version 3.16, it is possible to integrate the basemap.de web vector by adding a vector tile connection in the QGIS browser. Our videos, which you can find via the YouTube button on basemap.de, offer help. The XML file provided in the "Usage" area saves you from manually entering the connection parameters. However, QGIS does not yet fully support the Mapbox/Maplibre specifications we use.

Why are there differences in the timeliness of building data?

The building data (LOD1) is currently used from a nationwide central data storage system, which is updated annually by the states. We are currently working on making the building data available on a tighter timeline in the future.

How will I be informed about changes to basemap.de products and services?

About release notes and about the section news You can find out about product-related updates and changes.

Where can I find the metadata for the data and services you provide?

Meta information comes partly via the web services themselves (e.g. Capabilities), but can also be accessed via the BKG's Metadata Information System (MIS): LINK

Is there a possibility of routing or is this planned in the future?

No, there is no routing based on the data.

Will further basemap.de Web Vector projections be offered beyond Web Mercator in the future?

We are working on it and checking the technical possibilities.

My firewall blocks access to the products and services. Which IP addresses should I activate to use all services/products?

In order to be able to fully use all web services or products, your firewall or IT department should not block the following IP addresses:

- 81.168.145.64
- 141.74.48.15
- 141.74.64.15
- 141.74.64.40

DANGER: These IP addresses are only used to activate the firewall! The integration and use of the services and products should always take place via the URLs provided on the respective product pages.

License and Terms of Use


The following license and usage conditions apply:
Copyright © 2024 basemap.de 
@Webadmin
basemap.de
sort-amount-asc